A meteogram is a chart with time running left to right and several weather readings stacked on top of each other. Read it like a timeline: find the hour you care about on the bottom axis, then look straight up. The line gives the temperature, the bars give the rain, the arrows give the wind, and the strip on top shows the sky.
What a meteogram is
A meteogram is a chart of the weather at one place over time. Forecasters have used them for decades because they answer the question people actually ask: not "what is the weather?" but "what will it be doing at 4 PM on Thursday?"
Every meteogram shares the same skeleton. Time runs along the bottom, usually with a tick for every few hours and a label for every midnight. Above it, several readings share that one time axis. Because they are stacked, a single vertical glance tells you everything about one moment.
How to read each part
Different services draw meteograms differently, but the same five ingredients appear in almost all of them.
Temperature: the line
The temperature is nearly always a continuous line. It rises during the day and falls at night, so a normal week looks like a row of gentle hills. What to look for:
- The height of each hill is the day's high. The dip before it is the night's low.
- A hill that is missing, where the line stays flat through the afternoon, usually means thick cloud or rain all day.
- A sudden step down that does not follow the day-night rhythm is a cold front passing.
Precipitation: the bars
Rain and snow are drawn as bars rising from the bottom, one per hour. Taller means more water in that hour. A long run of low bars is steady light rain. A few tall, narrow bars are showers or a thunderstorm.
The bars show amount, not probability. If you want to know how likely the rain is, read what a chance of rain really means.
Wind: the second line and the arrows
Wind speed is often a second, thinner or dashed line. Arrows or barbs along it show direction. One convention trips people up: wind direction is named for where the wind comes from, but most arrows are drawn pointing where the air is going. A north wind's arrow points down the page, toward the south.
Peaks in the wind line matter more than the average. If the meteogram labels gusts, plan around those. See wind speed versus gusts for why.
Sky: the strip on top
Cloud cover is shown as a band across the top. In classic meteograms it is a grey shading that gets darker as cloud thickens. In newer ones it is drawn as an actual sky, with day and night, clouds, rain and lightning where they happen in time.
Now: the vertical line
A dotted or solid vertical line marks the present. Everything to the left has already happened. Everything to the right is the forecast.
Five patterns worth recognising
| What you see | What it means |
|---|---|
| Temperature drops sharply, wind arrows swing round, a burst of tall rain bars | A cold front is passing. Expect a short spell of heavy rain or storms, then cooler, clearer air. |
| Long run of low rain bars under a solid grey sky | A warm front or a slow low. Hours of steady rain, little change in temperature. |
| Big daily temperature swings, empty rain row, clear sky strip | High pressure. Sunny days and cold nights, often with fog at dawn in autumn and winter. |
| Tall isolated rain bars in the late afternoon, day after day | Heat-driven showers or thunderstorms. Mornings are the safe time to be outside. |
| Wind line climbing steadily for a day before the rain arrives | A deep low is approaching. The strongest gusts usually come with the rain or just after it. |
How to use it for real decisions
Once the parts are familiar, the meteogram becomes a planning tool. The trick is to look for gaps, not averages.
- A run or a bike ride: find a stretch with no rain bars and a low wind line. Two dry hours between showers are easy to see on a meteogram and invisible in a daily summary that just says "rain".
- Laundry, painting, a barbecue: you need a dry window and the hours after it. Look for a flat rain row that lasts until evening.
- Picking the best day of the week: compare the hills. The warmest dry afternoon is the tallest hill with nothing underneath it.
- Frost: look at where the temperature line touches or crosses 0 °C (32 °F) in the hours before sunrise.
Where a meteogram can mislead you
A meteogram looks precise, and that is its one weakness. A rain bar at 3 PM on day six is not a promise of rain at 3 PM. It is the model's best single guess, and timing errors of several hours are normal that far out.
A good rule: trust the hour for the next two days, the part of the day for days three and four, and only the trend after that. How accurate forecasts really are has the numbers behind this.
Showers are the other trap. Models know showers will form in an area but not exactly where, so the bars for a showery day are best read as "this is what a shower will be like if one finds you".
The meteogram in Magic Weather
Magic Weather calls its meteogram the weathergraph. It follows the classic layout with a few changes that make it quicker to read on a phone.
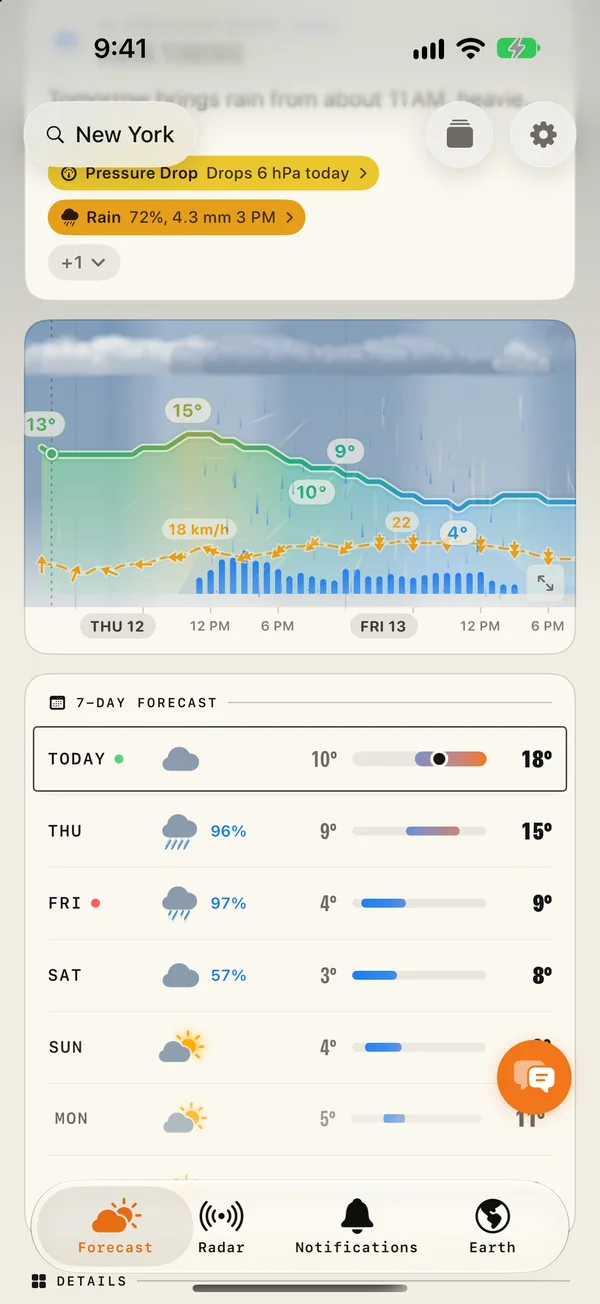
- The sky is drawn, not shaded. Day and night, clouds, rain, snow, fog and lightning appear where they happen in time.
- The temperature line is coloured by how warm it is, with the highs and lows labelled. At or below freezing the line ices over and a dashed line marks 0 °C.
- Wind is a dashed line with arrows that point where the wind blows. Windy peaks carry their speed.
- Press and hold anywhere and a card follows your finger with the time, temperature, wind, rain and sky at that moment.
- Pinch to fit one to four days on screen, swipe sideways to travel through the week, or open it full screen in landscape.
The same graph is available as a Home Screen widget and on Apple Watch, so the week is one glance away.
Common questions
What is a meteogram?
A meteogram is a time-series chart of the weather at one place. Time runs along the bottom and several readings (usually temperature, precipitation, wind, cloud cover and pressure) are drawn above it so you can compare them hour by hour.
What is the difference between a meteogram and a weather map?
A weather map shows many places at one moment. A meteogram shows one place across many moments. Use a map to see where the rain is, and a meteogram to see when it reaches you.
How far ahead can a meteogram be trusted?
The first two to three days are usually reliable hour by hour. From day four onward, read the shape of the lines (warming, cooling, a wet spell arriving) rather than exact hours, because timing errors grow with every day.
Why do the rain bars not match the rain percentage?
They measure different things. Bars show how much rain is expected in that hour, in millimetres or inches. The percentage is the chance of any measurable rain. A tall bar with a low percentage means a heavy shower that may miss you.